Reading a new LED datasheet without a comprehensive knowledge of what the parameters, measurements or graphs mean, can be a headache; even for a person with some background on the subject. Understanding LED Strips datasheets and photometric parameters might be more difficult for some people than others. But what if we as a manufacturer (SIRS-E®) provide easy access to understanding the parameters being tested and the reason behind why those parameters were chosen in the first place?
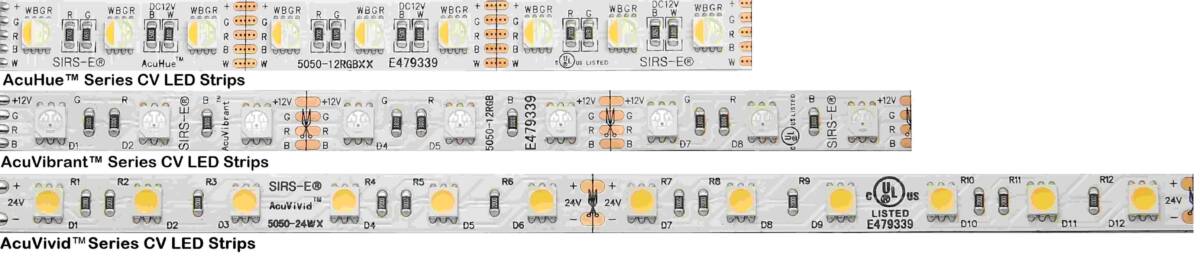
Here at SIRS-E®, we are excited to present our new and improved technical datasheets for our latest lines of higher quality LED strips: AcuVivid™ White, AcuVibrant™ RGB, and AcuHue™ RGBW & RGBA series.
While thinking about improving our product line of LED strips with innovative and higher quality, we also considered our customers, and their ease to have the technical information necessary for their projects, complete and readily available.
*Jump ahead to a list of photometric definitions and graphs.
In order to design a good datasheet that includes all necessary parameters, our SIRS-E® Engineering Team had to go back to hitting the textbooks and dusting off notes. We used the latest and most recognizable lighting standards in the industry in order to provide the parameters needed by the industry, not only the ones we want to provide. We used parameters recommended from standards written by the Illuminating Engineering Society of North America (IES), the American National Standards Institute (ANSI), the International Commission on Illumination (CIE), and others.
Back in 2006, when our Engineering Team was developing the first product lines of LED strips, there were only a few lighting standards being used in the industry, making every LED strip manufacturer use their own preference of parameters and measurements in their technical datasheets. Although, while this wasn’t a big issue back then, the Solid-State Lighting (SSL) industry has evolved technologically a lot, and today we have a well defined set of standards which the scientist community and LED manufacturers agreed on.
Although these standards keep evolving, SIRS-E® made sure to implement the latest and most important LED lighting standards being used in the SSL industry today to measure and evaluate our new LED strips. We provide our measured parameters in accordance to lighting standards such as:
– IES LM-79-2008: approved method for taking electrical and photometric measurements of SSL products
– IES TM-30-2015: New Method for Measuring Color Rendition
– ANSI C78.377-2015: Specifications for the Chromaticity of Solid State Lighting Products
– ANSI/IES LM-80-2015: Measuring Lumen Maintenance of LED Light Sources
– Specification of Small Chromaticity Differences by David L. MacAdam
– CIE 13.3-1995: Method of Measuring and Specifying Colour Rendering Properties of Light Sources
– CIE 15-2004: Colorimetry (the science used to measure the human color perception).
Our Engineering Team had to decide (using these standards) which parameters were the most relevant in the LED lighting industry and useful for the lighting professional today. For instance, we found parameters such as the MacAdam Ellipses (invented by David MacAdam in 1943) describe small chromaticity changes within a CCT quadrangle, which in simple words means how much the color temperature changes, usually used on SSL to indicate chromaticity changes from batch to batch. Meanwhile this is a great parameter to understand CCT consistency, it is also an obsolete way of measuring color consistency.
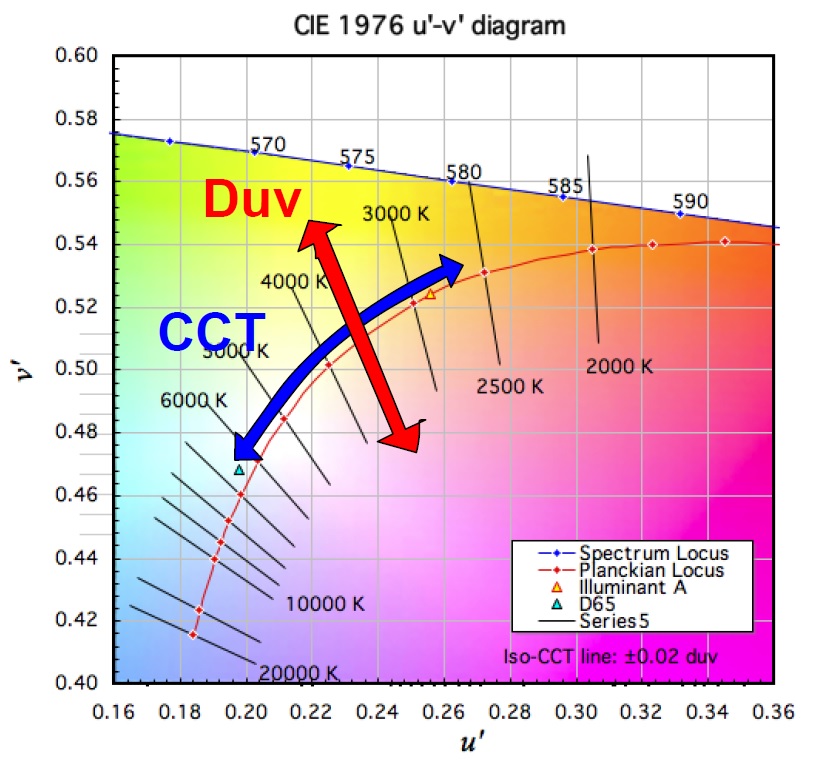
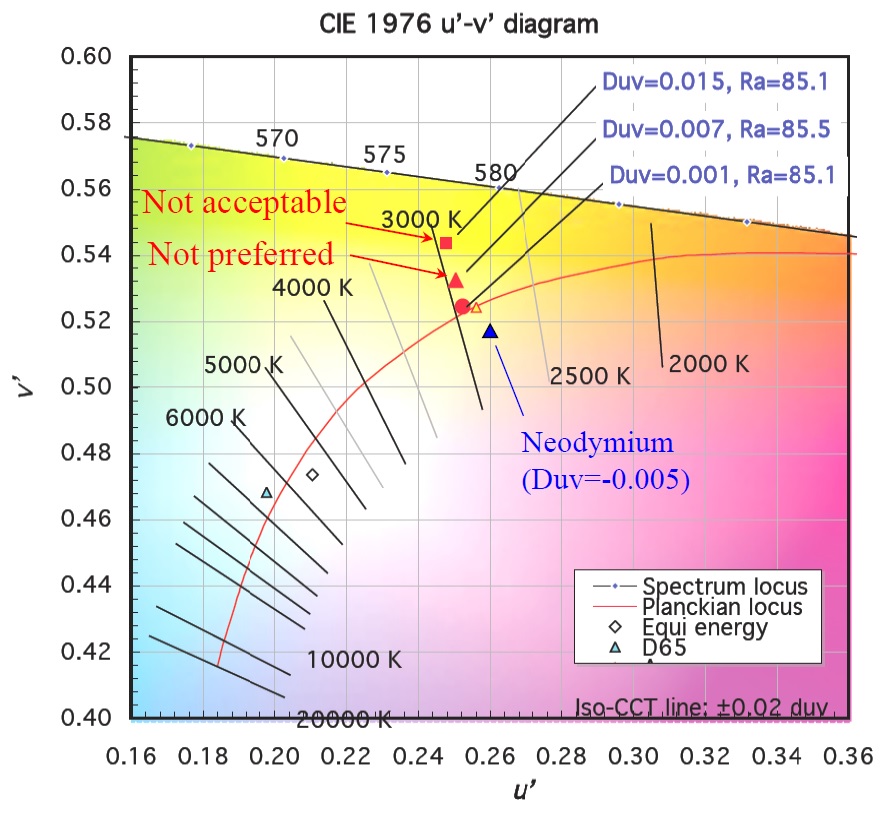
That’s why we used the ANSI C78.377-2015 standard to implement the Duv parameter into our datasheets, which is a more innovative and efficient way to measure color shift. ANSI mentions in that report that “The u’v’ circle is an alternate way of specifying chromaticity tolerances in simpler definition, replacing the old MacAdam Ellipses, as recommended by CIE.“ 1
1 American National Standard for Electric Lamps – Specifications for the Chromaticity of Solid-State Lighting Products (p. 12, Tech. No. ANSI C78.377-2015). (2015). Rosslyn, VA: NEMA.
1 CIE Technical Note – Chromaticity Difference Specification for Light Sources (pp. 3-4, Tech. No. CIE TN 001:2014). (2014). CIE.
Now, if you’ve read so far, it means you are really interested in learning more about our datasheets and photometry parameters; so here is a list of the most important terms and definitions used on our datasheets:
- Product Specs
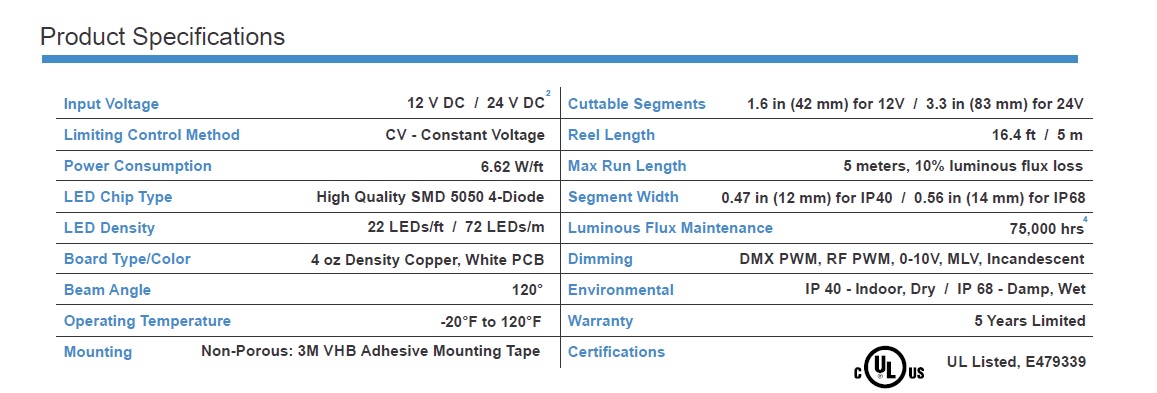
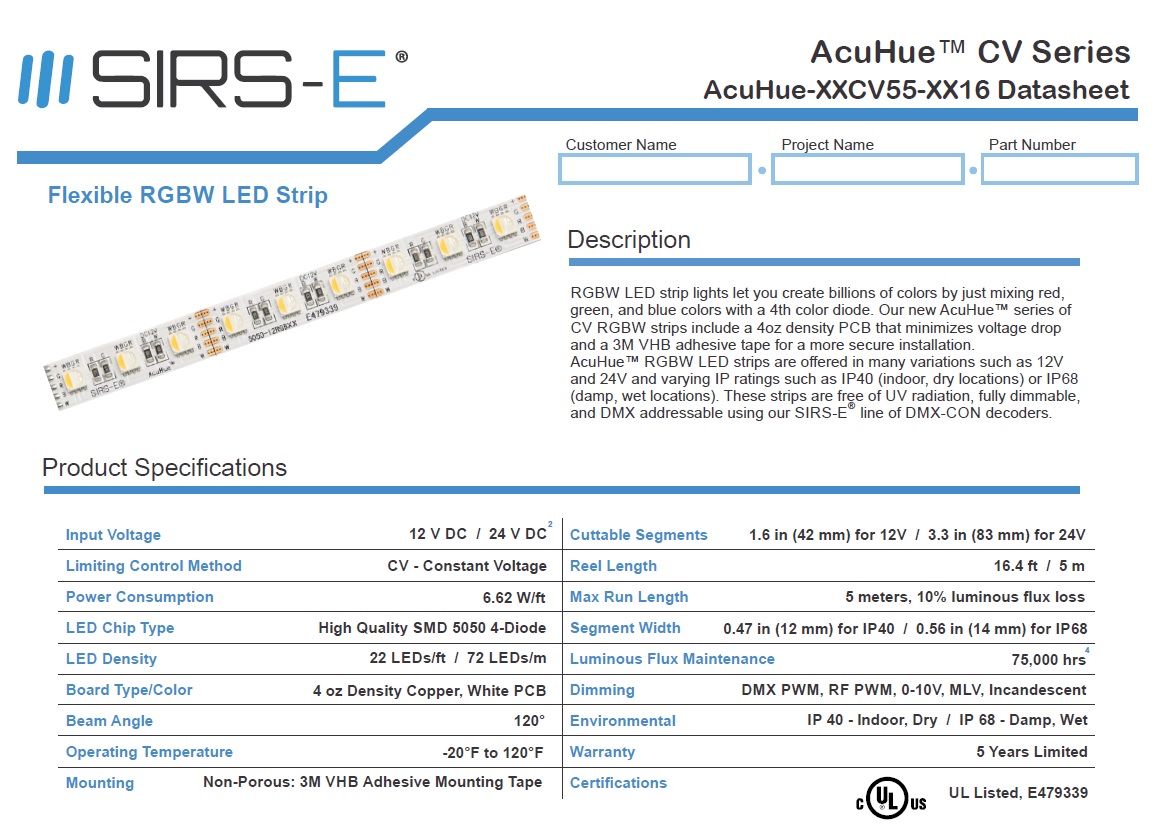
– Input Voltage: the voltage used to power the strip. (V DC)
– Limiting Control Method: Constant Voltage (CV) keeps the voltage constant and changes the current, Constant Current Control (CC) keeps the current constant.
– Power Consumption: the energy required to power a specific length of strip. (W/ft) We use in the datasheet the maximum specified by UL for Class 2, true power consumption can be found in the photometric reports
– LED Chip: an SMD enclosure containing 3 diodes (Whites and RGB strips) or 4 diodes (RGBW strips)
– Board Type: 4oz density copper PCB. This means its 4 oz of copper for every 1 sq-ft of PCB area. Higher quality density boards minimize voltage drop significantly.
– Luminous Flux Maintenance: this represents the luminous flux depreciation over time, usually labeled in hours (hrs).
– Environmental: IP40 (Dry, Indoor applications), IP68 (Damp, Wet, Outdoors applications)
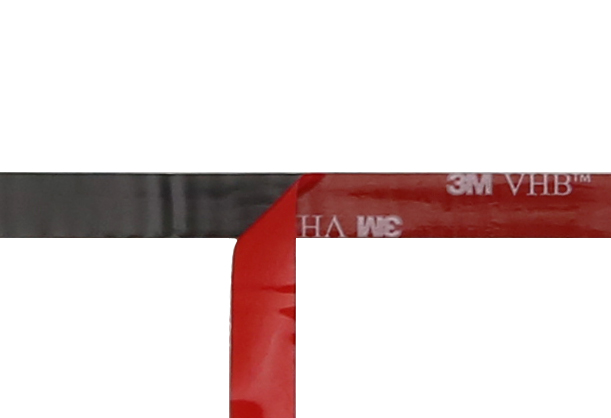
– Mounting: 3M VHB (Very High Bonding) adhesive tape is a very high quality acrylic foam-type tape that is also used in automotive, industrial and aerospace applications.
- IES LM-79-2008, ANSI C78.377-2015, CIE 13.3-1995 & CIE 15-2004 Parameters
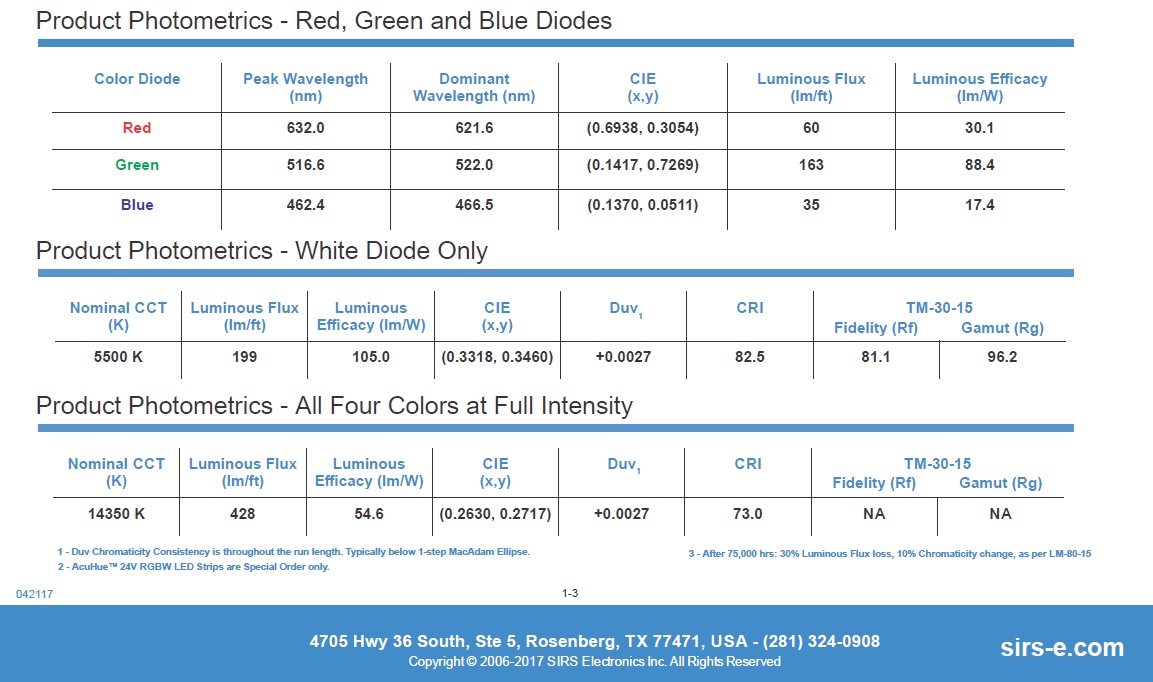
– Color Diode: the color of each individual diode inside an LED chip enclosure.
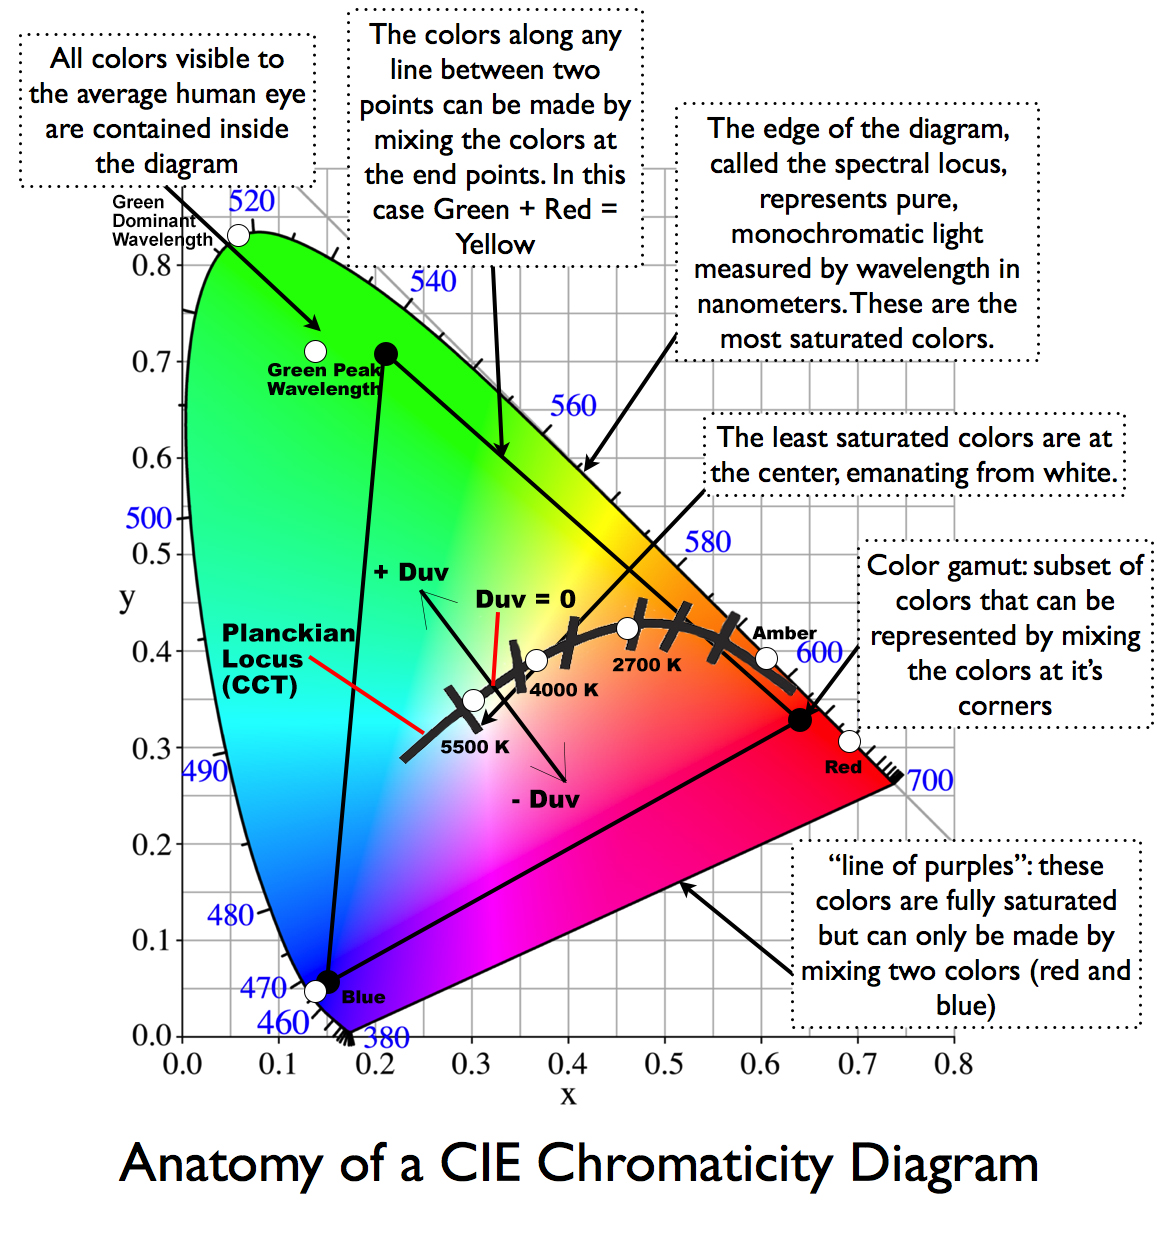
– Peak Wavelength: the wavelength of the peak of the spectral density curve. (nm)
– Dominant Wavelength: describes the perceived color of the LED shown in the CIE diagram.
– CIE Chromaticity coordinates: represents a black body diagram with all the possible color wavelengths in the visible spectrum, coordinates indicate a specific point in the diagram (x,y)
– CRI: the Color Rendering Index (Ra) shows an average measurement of how a light source perceives the colors in comparison to an natural light source. A value of how “true” the color is.
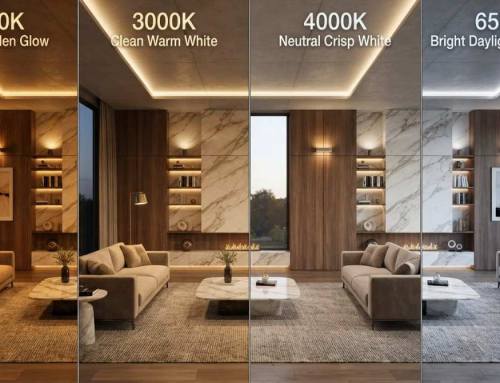
– Nominal CCT: the Correlated Color Temperature in increments of 100K that is closest to the true CCT (Target CCT). It is measured in degrees Kelvin (K) because it is representing the “temperature” color which more closely resembles the perceived color on the spectrum. Shown on a CIE chromaticity diagram by the Planckian Locus.
– Luminous Flux: the quantity of light intensity perceived by the human eye. (lumens)
– Luminous Efficacy: the efficiency of a light source represented by the intensity of light versus the power consumption (lm/W) – Average Good Efficacy 80-120 lm/W
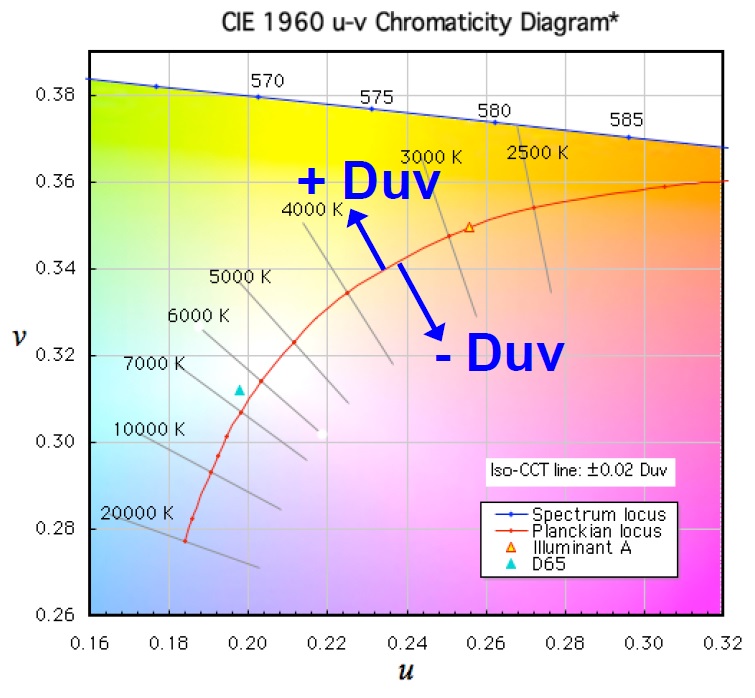
– Duv: the distance between the true chromaticity coordinate and the Planckian Locus. In other words is the color shift from Green to Pink in the CIE diagram.
 |
 |
Calculation of CCT and Duv and Practical Conversion Formula
- IES TM-30-2015 Parameters
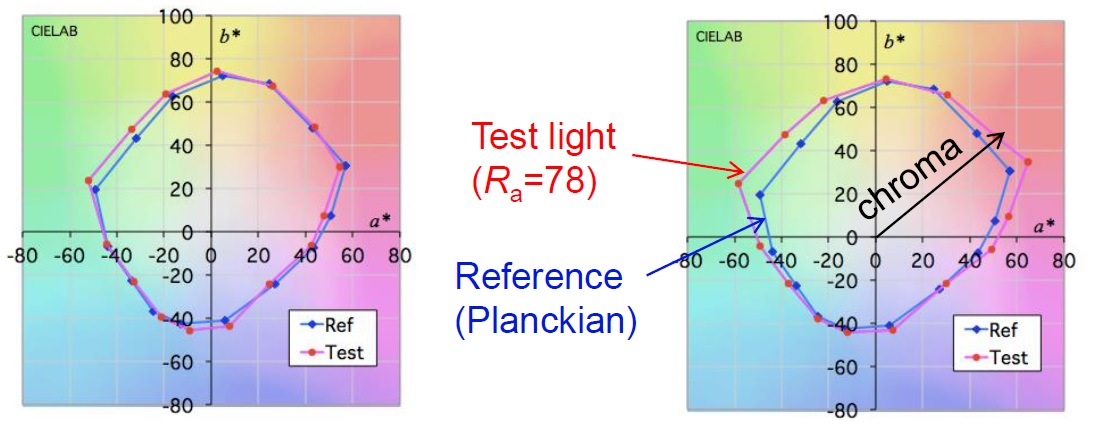
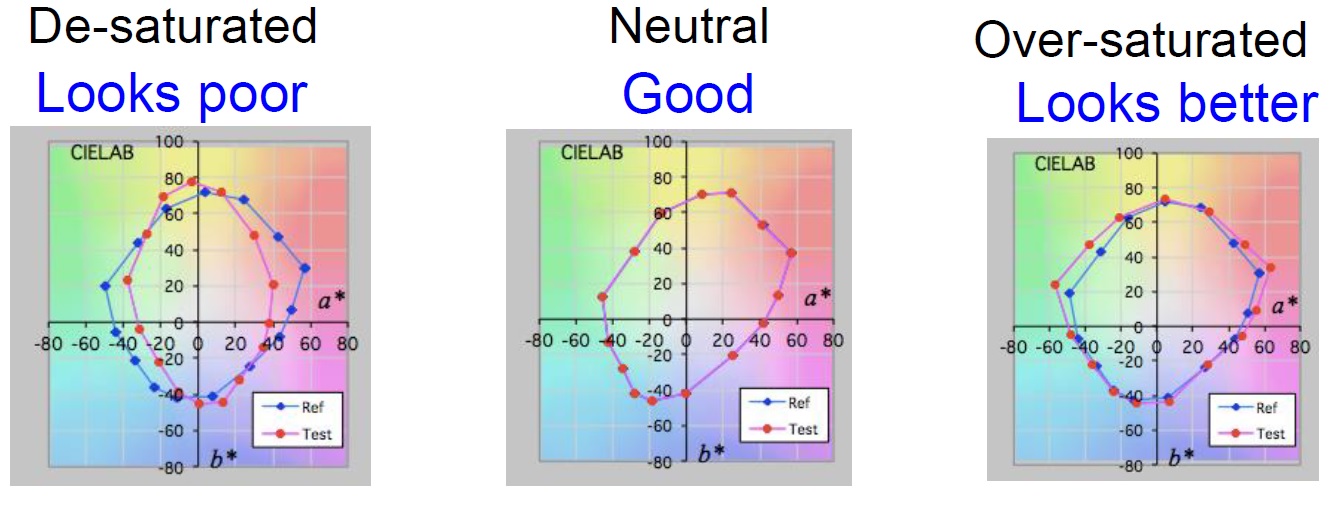
– Fidelity (Rf) and Gamut (Rg): Fidelity (values 0-100) characterizes the color rendering with 99 values, where typical CRI tests 14. Gamut (values 60-140) compares the area enclosed by the average chromaticity coordinates to characterize saturation levels. The TM-30 shows how saturated or desaturated the color rendition is on the light.
Which picture looks better?
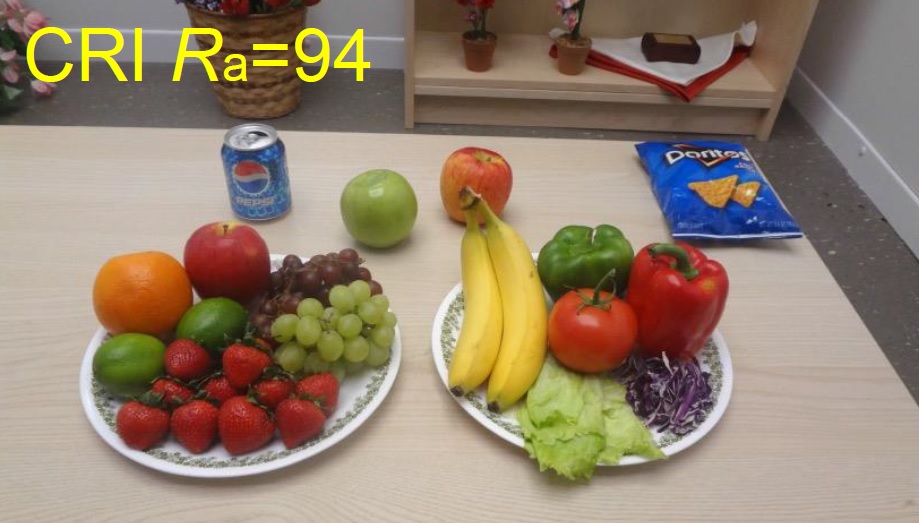
Picture A
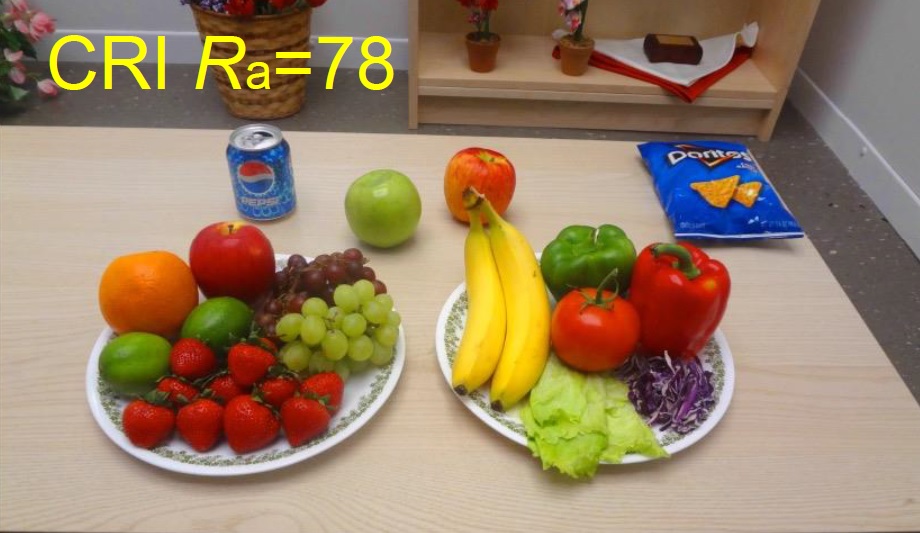
Picture B
Most people would say Picture B looks better, but in reality, Picture B is over-saturated.
Picture A Picture B (too much Green & Red)
IES TM-30-2015 shows us that the Color Vector Graphic is represented as follows:
- Lighting Standards Used
– ANSI: American National Standards Institute
– IES: Illuminating Engineering Society
– CIE: (Commission internationale de l’éclairage) International Commission on Illumination
– IES LM-79-2008: approved method for taking electrical and photometric measurements of Solid-State Lighting products
– IES TM-30-2015: Method for Measuring Color Rendition
– ANSI C78.377-2015: Specifications for the Chromaticity of Solid State Lighting Products
– ANSI/IES LM-80-2015: Measuring Lumen Maintenance of LED Light Sources
– Specification of Small Chromaticity Differences by David L. MacAdam
– CIE 13.3-1995: Method of Measuring and Specifying Colour Rendering Properties of Light Sources
– CIE 15-2004: Colorimetry (the science used to measure the human color perception.
– CIE TN 001-2014: Chromaticity Difference Specification for Light Sources
Written by: Jorge Barrera
Revised by: Diego Iorio
 (1)")